Climate change is one of the greatest issues facing society. With an overwhelming scientific consensus on the effect of man-made carbon emissions on climate change, many world governments are aiming to reduce their reliance on fossil fuels. With an increase in the amount of renewable energy sources and electric vehicles on the road, there is a new issue that we need to tackle. The power output from renewable sources isn’t constant and with EV charger peak times being different we are left with an abundance of energy when it’s least needed. To relieve the strain being placed on the grid and transition to a more sustainable future we need smarter infrastructure that is better capable of dealing with congestion.
In this article, I’m going to discuss how I managed to build a platform that monitors the power consumption of EV chargers and predicts future consumption using machine learning. If you are interested in further discussion on the IoT/Cloud side of things check out the video I made on the topic.
This project had a few main parts:
-
The embedded system to monitor and calculate the power being consumed.
-
Communication channels between the chargers and gateways.
-
The cloud services for processing data and running the ML models.
-
A custom dashboard that stakeholders could use to see data.
The first thing I needed was a way to measure and gather the data needed to perform further analysis. There are two use cases for a platform like this, chargers that are out in the public and chargers that are in people’s homes. For Level 2 chargers that people have in their homes, MQTT can be used with their Wi-Fi router to send data to the cloud. Things get a bit trickier with the public chargers though. Since they aren’t near a reliable Wi-Fi connection another communication protocol is needed.
I chose to use LoraWan a protocol that allows devices to send messages up to 10 Km away. I decided to use LoraWan as it had better bandwidth and more public gateways than SigFox and it was way cheaper than using a cell network. For each device, I needed to create a client that would measure the power using a current clamp sensor and send via MQTT or LoraWan. The code for each of these can be seen in the Githubs below.
https://github.com/CoogyEoin/ev_mqtt_monitor
https://github.com/CoogyEoin/MQTTHandler
I wrote in a previous article about how I set up a continuous integration/development pipeline for these devices so they can be remotely updated. Check it out if you’re interested.
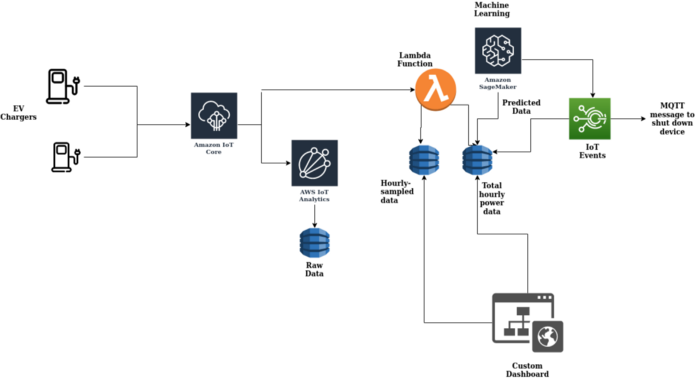
I decided to use AWS as a cloud provider because I was most familiar with their services. I set up a full data pipeline that stored the raw data, sampled the data per hour and stored it, calculated the combined power load across all devices and stored that, invoked a ML model bi-daily and monitored the power to see if it had reached a threshold. The predicted power values were also checked with the same service to see if the power was too high. If the power exceeded a threshold an MQTT message was sent to the device to shut it down. This was congestion can be dealt with before it happens. A diagram of the pipeline can be seen below.
The data that was being collected from the devices only contains power in Watts and a timestamp. The problem of trying to be tackled is a simple time-series prediction.
I also added a value for a shortage sensor reading in case something like this might be needed in the future. Sometimes the cables of these chargers deteriorate and the current shorts to the car’s chassis which is a very serious health hazard and relevant stakeholders should be notified immediately. It wasn’t analysed in this project though.
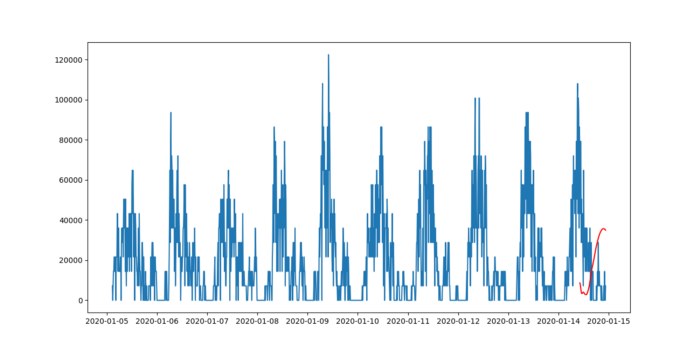
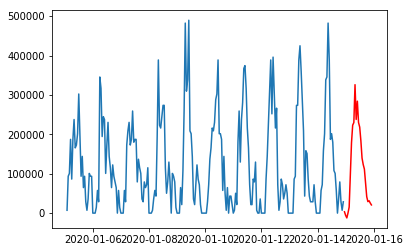
I had an extremely hard time trying to find datasets for this model. With the Coronavirus going around I decided the best thing to do is to create a script for generating fake data. I knew that there were peak times that people would use the chargers (I chose 9am when people get to work and 1pm when they’re on break). So I used these times as weights and using Gaussian distributions I generated random time values that emphasized these values. A diagram of this data plotted can be seen below.
This script may be useful to some people so I figured I’d create a separate Github repo for it. Check it out if you’re interested.
https://github.com/CoogyEoin/TimeSeriesDataGenerator
EV chargers have specific peak times that they are used which makes the data reasonably periodic. So a traditional signal analysis method such as Fourier analysis could be used. The problem with this is that external events (nice weather, sporting events etc..) have a large impact on the power consumption and these events can drastically throw off the model.
Deep learning algorithms have been used for many different types of problems such as classification and prediction like this problem. RNN models are particularly good at dealing with sequential data. The problem with ordinary RNN models is the weights it attributes to historic data over recent data. With this project, the most recent power values are much more important than historic trends when making a prediction.
Long Short Term Memory (LSTM) is a model that is used with sequential data like RNNs but allows us to emphasis recent data (In this case the past 12 hours). Although I haven’t tested other algorithms I got a Mean Square Average error value of 0.009 with this model. The Jupyter notebook can be seen in my GitHub repo below.
https://github.com/CoogyEoin/EV-charger-power-forecast-model
Once we had the model a sagemaker instance was spun up on AWS and a lambda function invokes it twice a day. It reads in data from the dynamoDB table holding the total power values across all the devices and writes the predicted values to the same DB. All values that arrive in this table are fed through the IoT events service which checks to see if they’re too high. If they exceed a threshold (6 MW) it sends a message down to all the devices to start their shutdown sequence.
I created a simple Django webpage that queries AWS every few minutes and plots the real time data. If you want you can check it out in the video.
There are a lot of things I could have done differently or refactored but this being my final year project I wanted to get something working that I could show. There’s a lot of things that could be added such as better integration with the LoraWan backend or a cloud formation template for setting new users up. The platform overall monitors the power being consumed from EV chargers, predicts power consumption for the next 12 hours and automatically balances the demand before the consumption becomes a problem.
Hopefully, services like this can be used in the future so that we can make our energy use more sustainable.